Dengue Infection Probability Model
How It Works
This model predicts the probability that a new dengue case will be reported within the next 2 weeks
at any location. This is a concrete prediction that can be verified against actual case reports.
Transmission Pathways
1. Local Mosquito Transmission (20% probability)
Infected mosquitoes spread disease locally within ~200m of existing cases.
2. Hidden Transmission (10% probability)
Intermediate-range spread (~800m) through undocumented transmission pathways including unreported cases, asymptomatic carriers in local communities, and environmental factors.
3. Human Mobility (10% probability)
Asymptomatic or unreported cases travel and spread disease over longer distances up to ~12km.
Total: 40% probability that each existing case generates a new reported case within 2 weeks.
Model Assumptions
- Mosquito Flight Range: Aedes aegypti mosquitoes fly ~100m on average (Moore & Brown[1]), but we use σ₁ = 200m to account for geolocation uncertainty in address-based reporting and movement of the infected person around their property (home, workplace, nearby areas)
- Hidden Transmission Range: Intermediate spread at σ₂ = 800m captures undocumented transmission through local community movement, unreported cases, and environmental factors not captured by direct mosquito flight or long-distance travel
- Human Mobility: Asymptomatic carriers travel up to ~12km daily, spreading infection through human movement patterns (σ₃ = 6000m)
- Time Window: We assume a time lag of up to 2 weeks between case reporting events which are closely linked in a transmission chain, based on the dengue intrinsic incubation period (mean 5.9 days, 95% range 3-10 days[2]) and reporting delays. Virus concentration in the bloodstream is detectable 24-48h before symptom onset and can last 10-12 days[3]
- Transmission Rates: Model parameters have been calibrated to observed case data (2025-11-09, Kuala Lumpur region), resulting in a 40% total probability for observed transmission: mosquito transmission (20%), hidden transmission (10%), and human mobility (10%)
- Spatial Distribution: Uniform spread in all directions using Gaussian kernels, ignoring environmental barriers and mosquito breeding site locations
Risk Levels (per km²)
- Low: <0.01% chance of new case in 2 weeks
- Moderate: 0.01%-5% chance
- High: 5%-20% chance
- Very High: >20% chance
Limitations
- Assumes uniform spread in all directions
- Ignores environmental factors (weather, buildings, water sources)
- Uses fixed transmission rates
- Doesn't account for immunity or seasonality
Data Source
Input Data: Dengue case locations and counts from
iDengue Portal - Ministry of Health Malaysia
Update Schedule: Data is refreshed daily from the official government source
Model Independence: Our probability model is separate from iDengue. We use their reported case data as input to calculate transmission risk using our own mathematical framework.
Model Validation
The model has been validated against actual case reporting data from the Malaysian Ministry of Health.
The validation process involved making stochastic predictions for each grid cell in the sample area and comparing
them with actual reported case counts over a 2-week period in the Kuala Lumpur region.
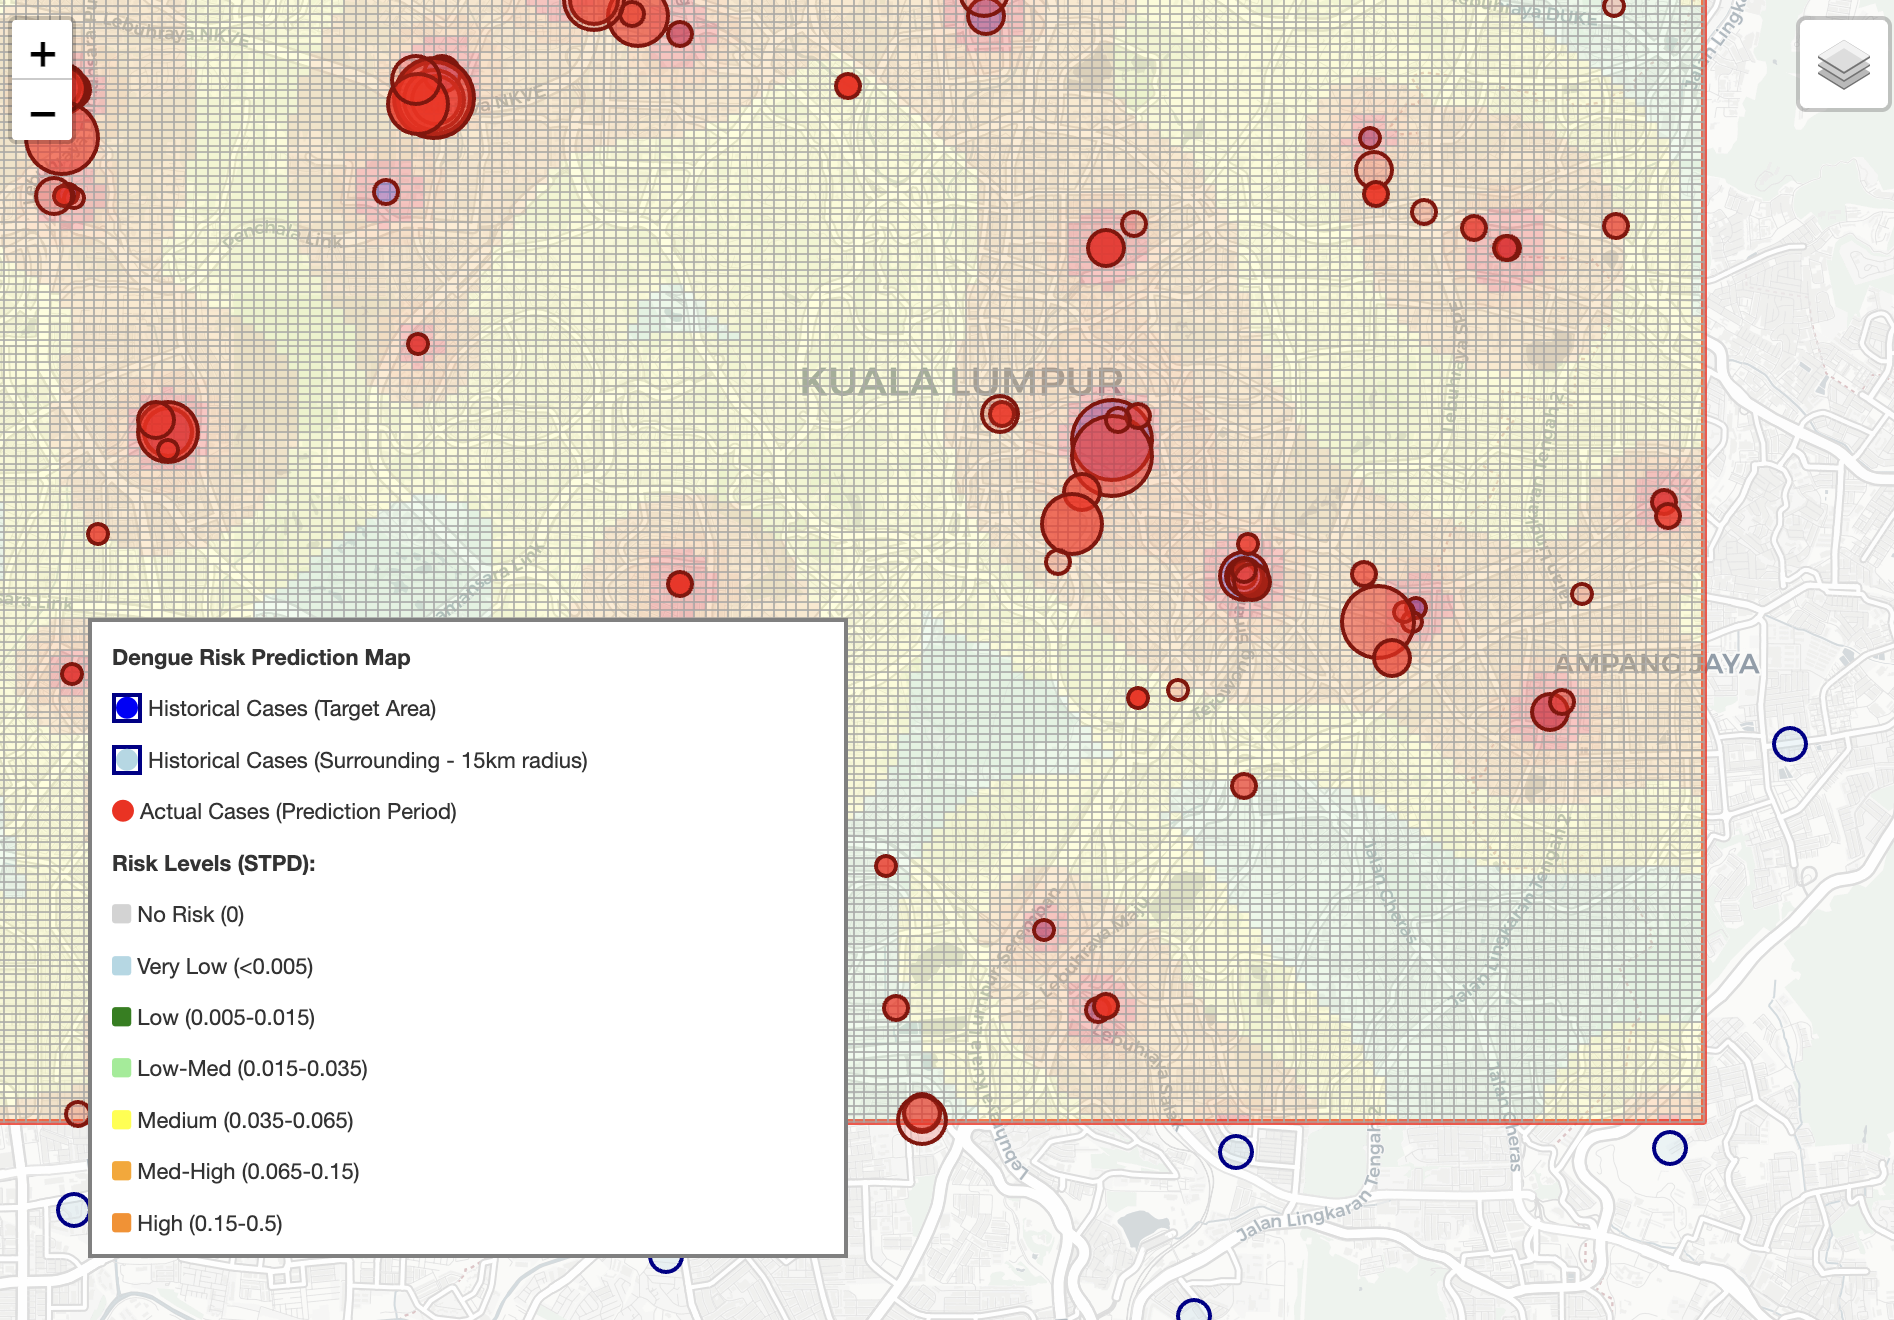
Figure 1: Geographic area used for model validation, showing the grid cells where stochastic predictions
were made and compared against actual case reports over a 2-week evaluation period.
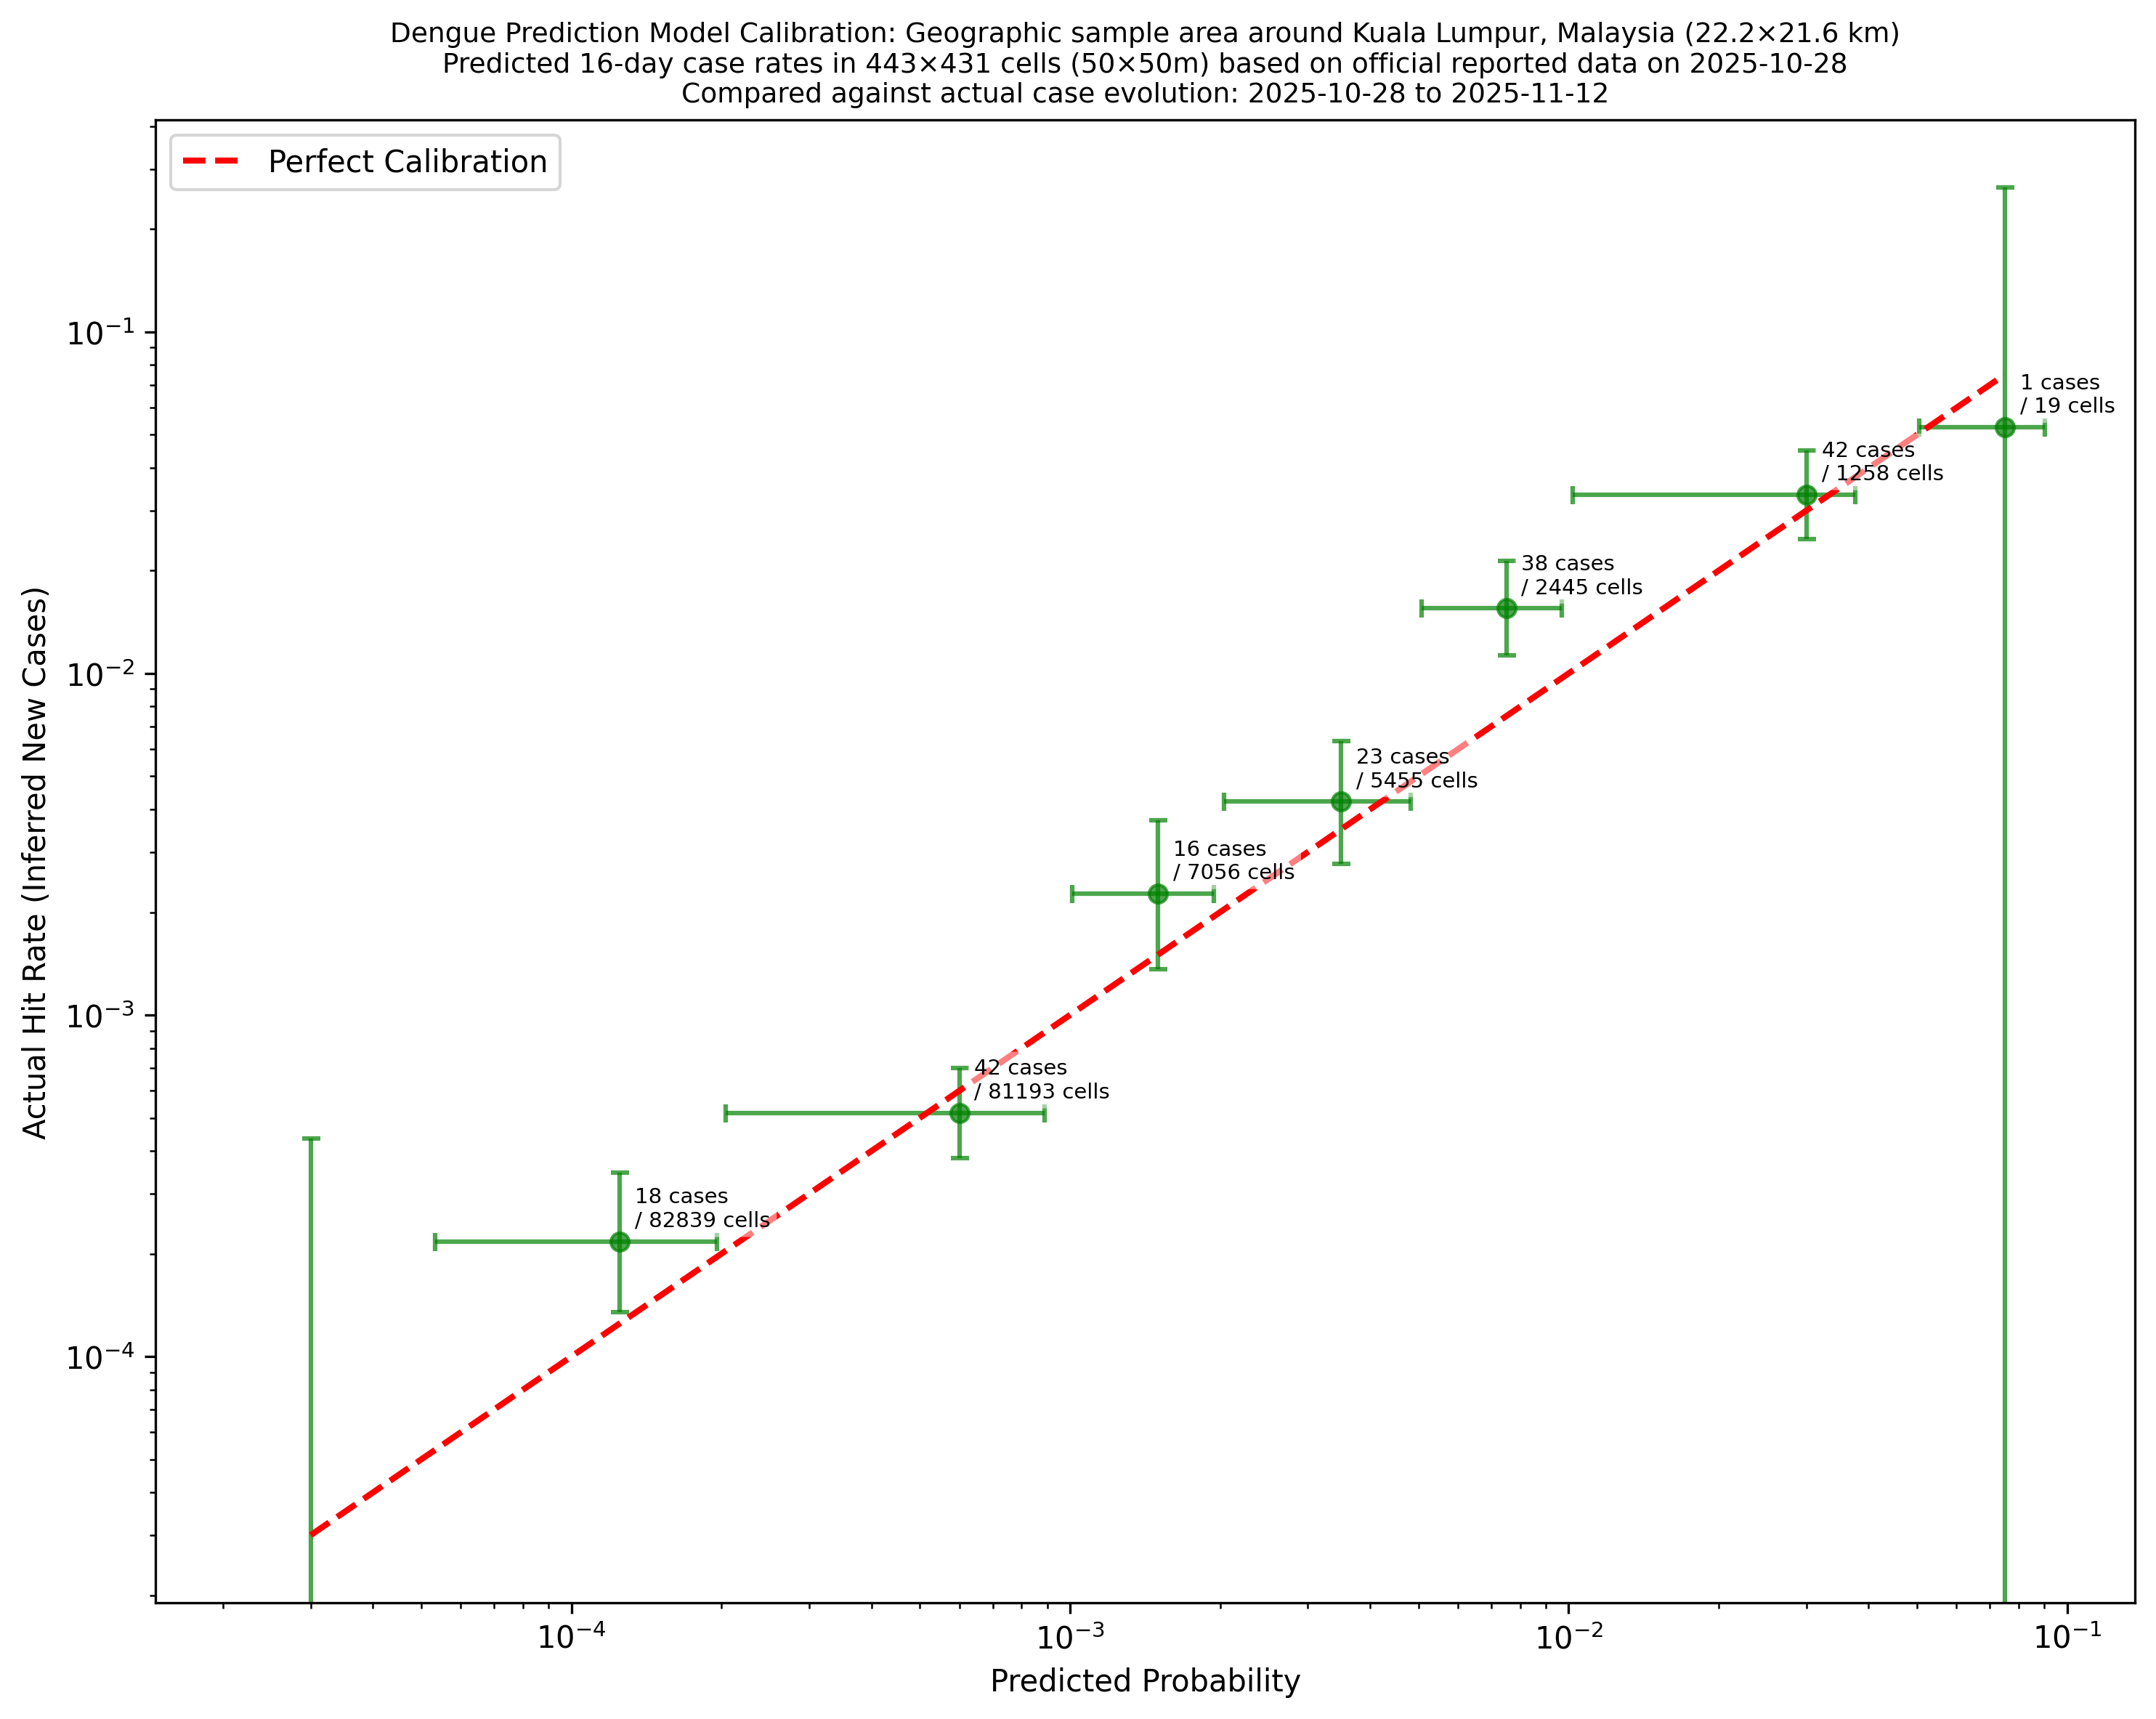
Figure 2: Model calibration showing predicted infection rates versus actual reported cases,
verifying consistency with the case reporting history of the Malaysian Ministry of Health.
Mathematical Formula
P(x,y) = Σᵢ nᵢ · [p₁ · G(d, σ₁) + p₂ · G(d, σ₂) + p₃ · G(d, σ₃)]
where G(d, σ) = (1/2πσ²) · exp(-d²/2σ²)
Fitted Parameters (Calibrated 2025-11-09):
P(x,y) = Probability of new case at location (x,y) within 2 weeks
nᵢ = Number of existing cases at location i
d = Distance from (x,y) to case i in meters
p₁ = 0.2 (mosquito transmission probability)
σ₁ = 200m (mosquito range standard deviation)
p₂ = 0.1 (hidden transmission probability)
σ₂ = 800m (hidden transmission range standard deviation)
p₃ = 0.1 (human mobility transmission probability)
σ₃ = 6000m (human travel range standard deviation)
G = Gaussian kernel function
Model Components Visualization
The three transmission pathways contribute differently to the overall infection probability based on distance from existing cases.
The plot below illustrates how each component (mosquito transmission, hidden transmission, and human mobility)
contributes to the total infection reporting probability around a reported case.
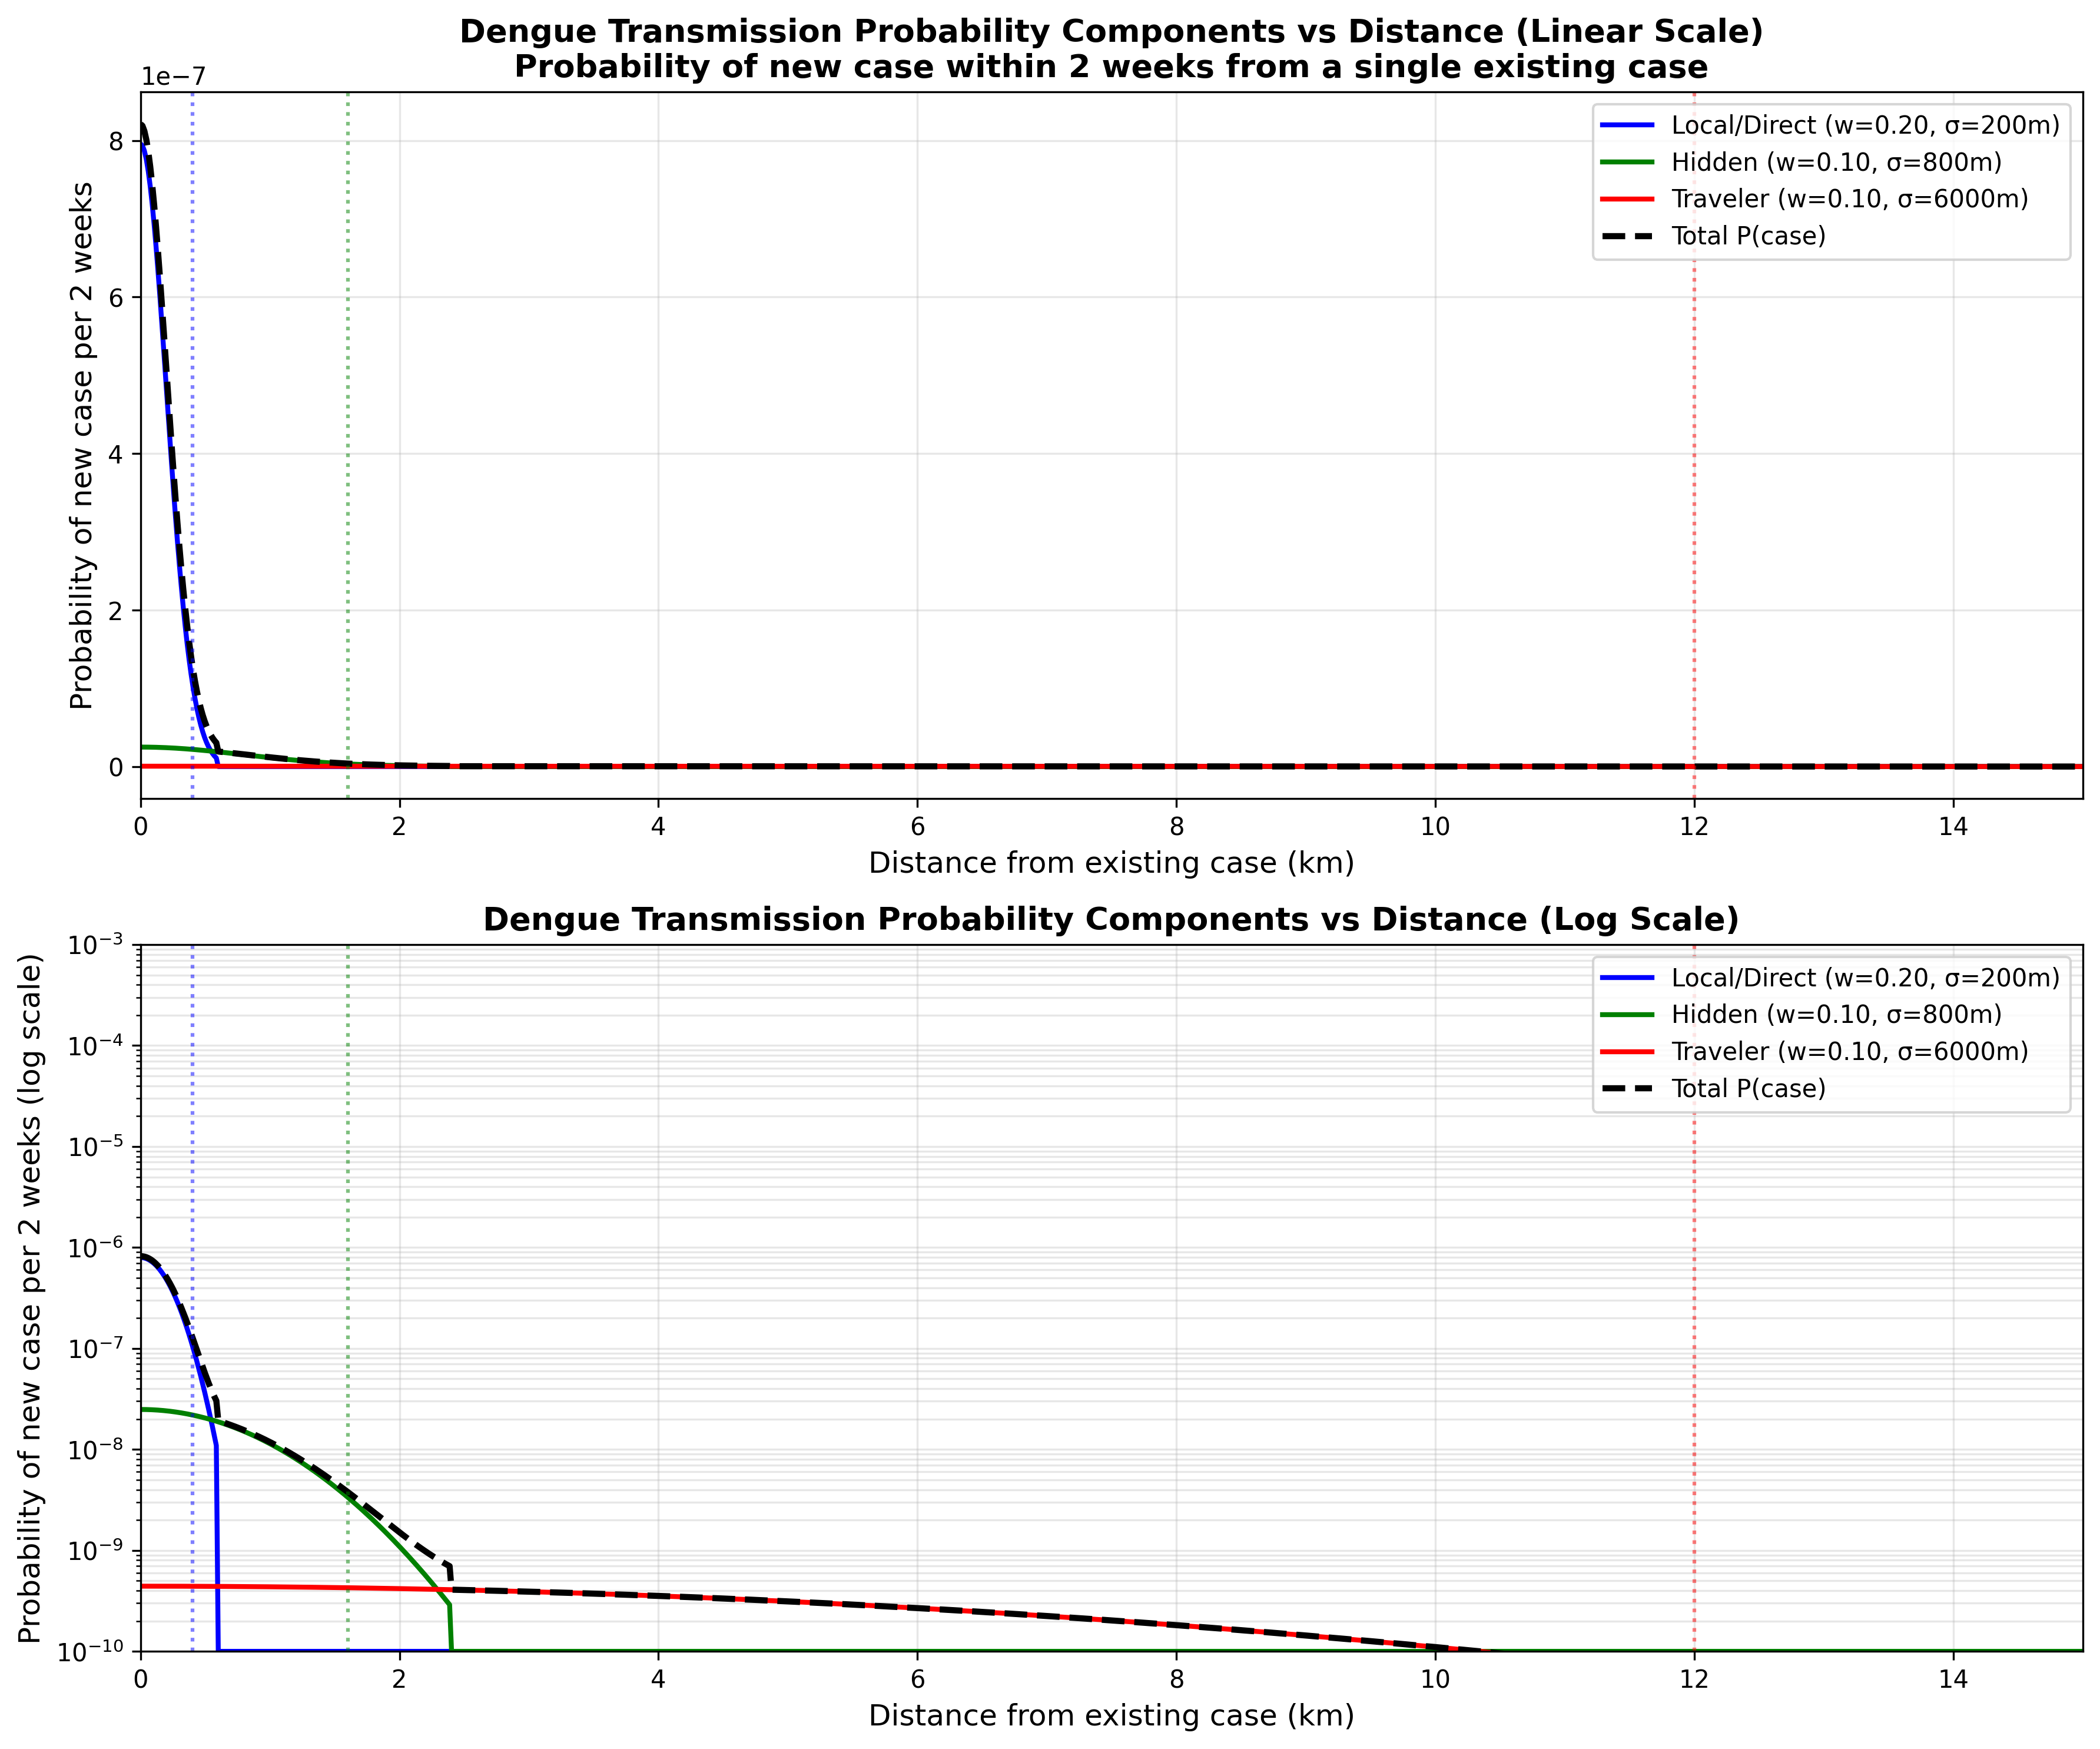
Figure 3: The three components of the model showing how mosquito transmission (short-range),
hidden transmission (intermediate-range), and human mobility (long-range) contribute to
the infection reporting probability at different distances from an existing case.
References
[1] Moore, T.C. and Brown, H.E. (2022). Estimating Aedes aegypti (Diptera: Culicidae) Flight Distance: Meta-Data Analysis. Journal of Medical Entomology, 59(4), 1164–1170. Shows mean flight distance of 105.69m (95% CI: 87.68-123.69m). DOI: 10.1093/jme/tjac070
[2] Chan, M., & Johansson, M. A. (2012). The Incubation Periods of Dengue Viruses. PLoS ONE, 7(11), e50972. DOI: 10.1371/journal.pone.0050972
[3] Nanaware, N., Banerjee, A., Mullick Bagchi, S., Bagchi, P., & Mukherjee, A. (2021). Dengue Virus Infection: A Tale of Viral Exploitations and Host Responses. Viruses, 13(10), 1967. DOI: 10.3390/v13101967
← Back to Map